
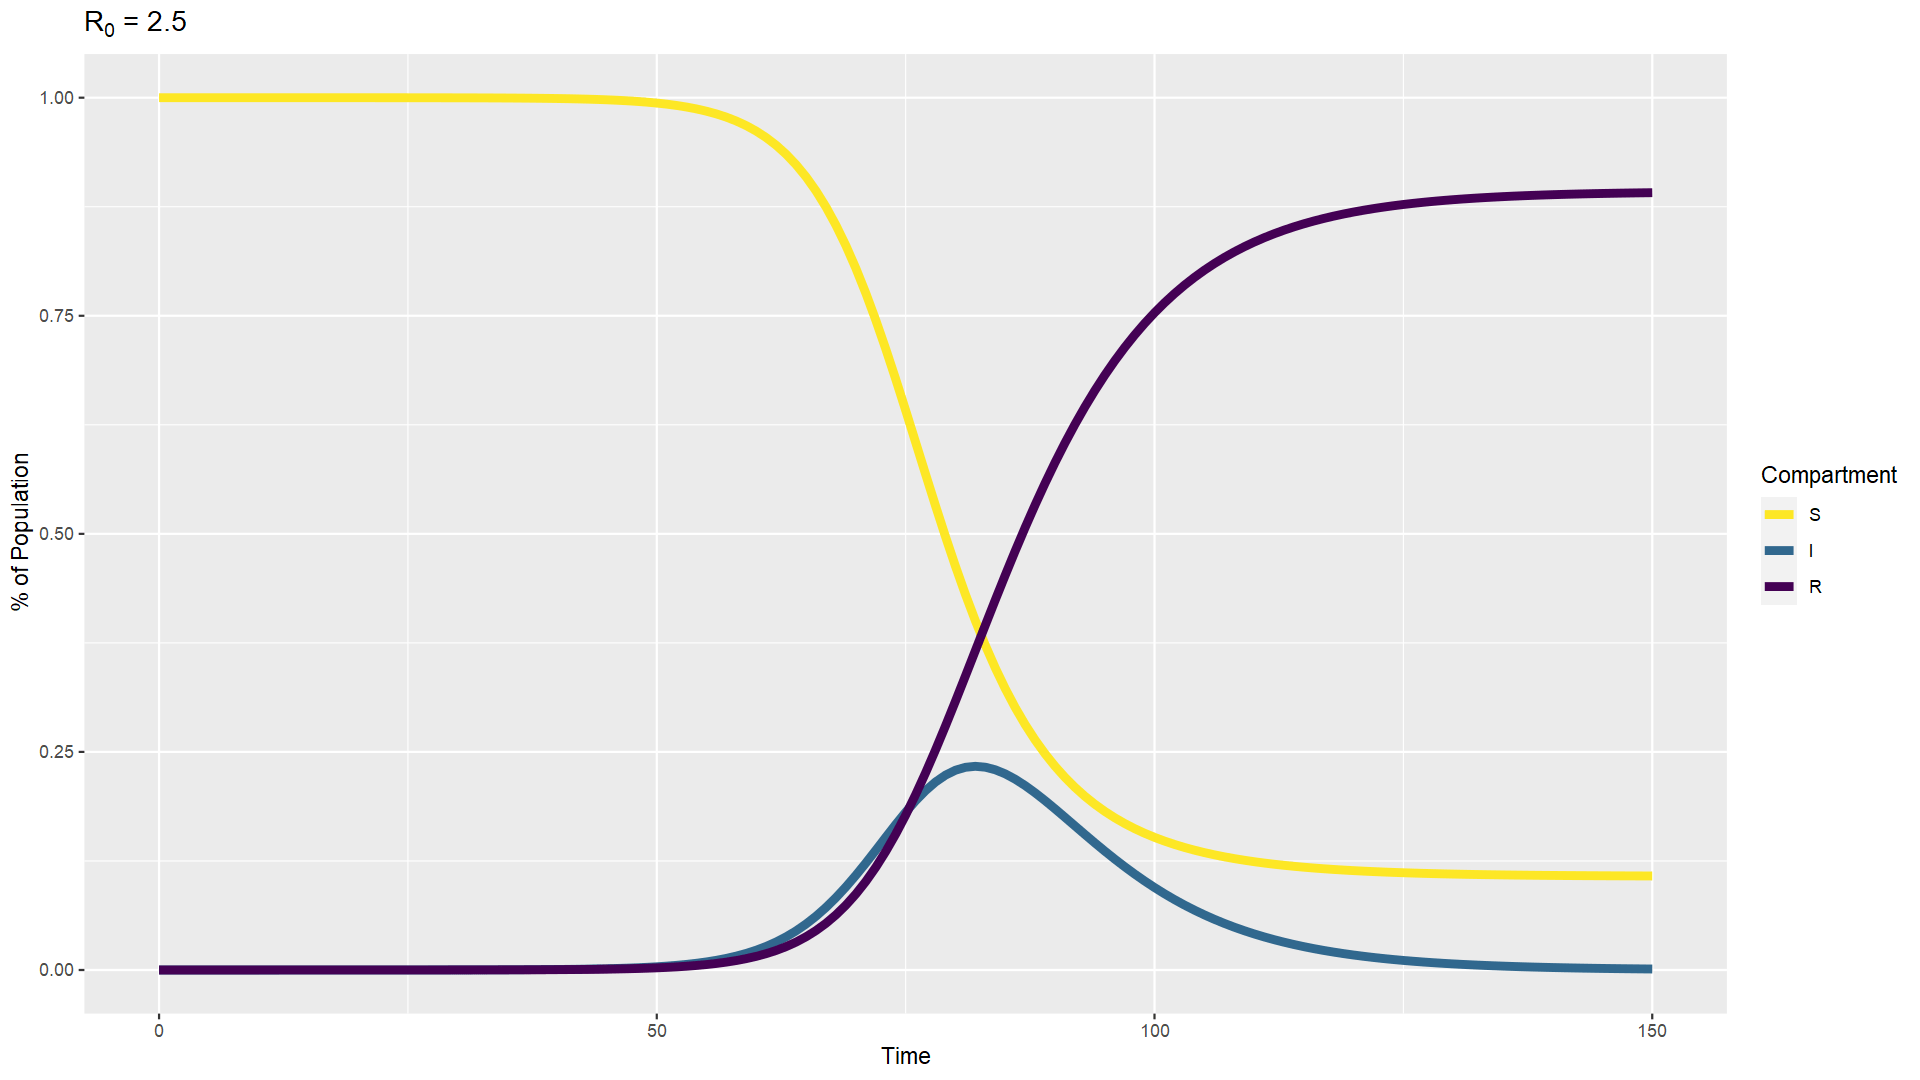
I imagine many of you have learned more about herd immunity in the past 18 months than you ever wanted to: what it is, how many people have to be vaccinated to achieve it, whether we’ll ever get there or if that is even the right goal. And yet one aspect I have not seen widely reported on is what happens after we get there. Human behavior remains a significant driver of the pandemic, and our expectations will influence our emotional reactions to future events which will impact our future behavior. So what do you expect will happen after herd immunity? As a way to think about that question, consider the chart on the right. The blue/medium line represents infections over time, and the purple/dark line represents immune people. Where on that chart do you think herd immunity has been reached?
That chart is the output of an SIR model, a fundamental tool in understanding and predicting how diseases spread. The people in a population can belong to one of three categories. Susceptible (S) people have no immunity and can become infected; Infected or Infectious (I) people have the disease and can spread it to others; Recovered or Resistant (R) people no longer have an infection and are immune. The equations of the model describe how the fraction of the population in each category changes over time. Typically, we introduce a small number of infected people to an otherwise susceptible population and then see what happens. One consistent pattern is that not everyone gets infected; there are still some susceptible people at the end of the simulation. This suggests that if enough people are resistant (immune), some susceptible will benefit from everyone else’s immunity without becoming infected (or vaccinated) themselves. However, the herd immunity threshold is not the percentage of resistant people at the end of the simulation. Herd immunity comes before that.
So where does herd immunity come in? Those model equations depend on two parameters that are specific to the biology of the disease, and from those two parameters we can calculate R0, the number of people who will get infected from a single infectious person when everyone’s susceptible. The subscript zero (0) in R0 refers to time zero, the beginning of the pandemic. Over time, the number of people who will get infected from a single infectious person will drift down, because that infectious person will start to encounter immune people and be unable to infect them. As long as that number (Rt for time t, or Re for effective, or sometimes just R) is above one, the outbreak can perpetuate itself. Once Rt gets below one, each infectious person “replaces” themselves with less than one other infectious person, and so the outbreak becomes self-limiting. Thus we can ask when does Rt become exactly one, and with some algebra we find that it’s when the fraction of immune people is equal to 1 – (1 / R0). That number is the herd immunity threshold.
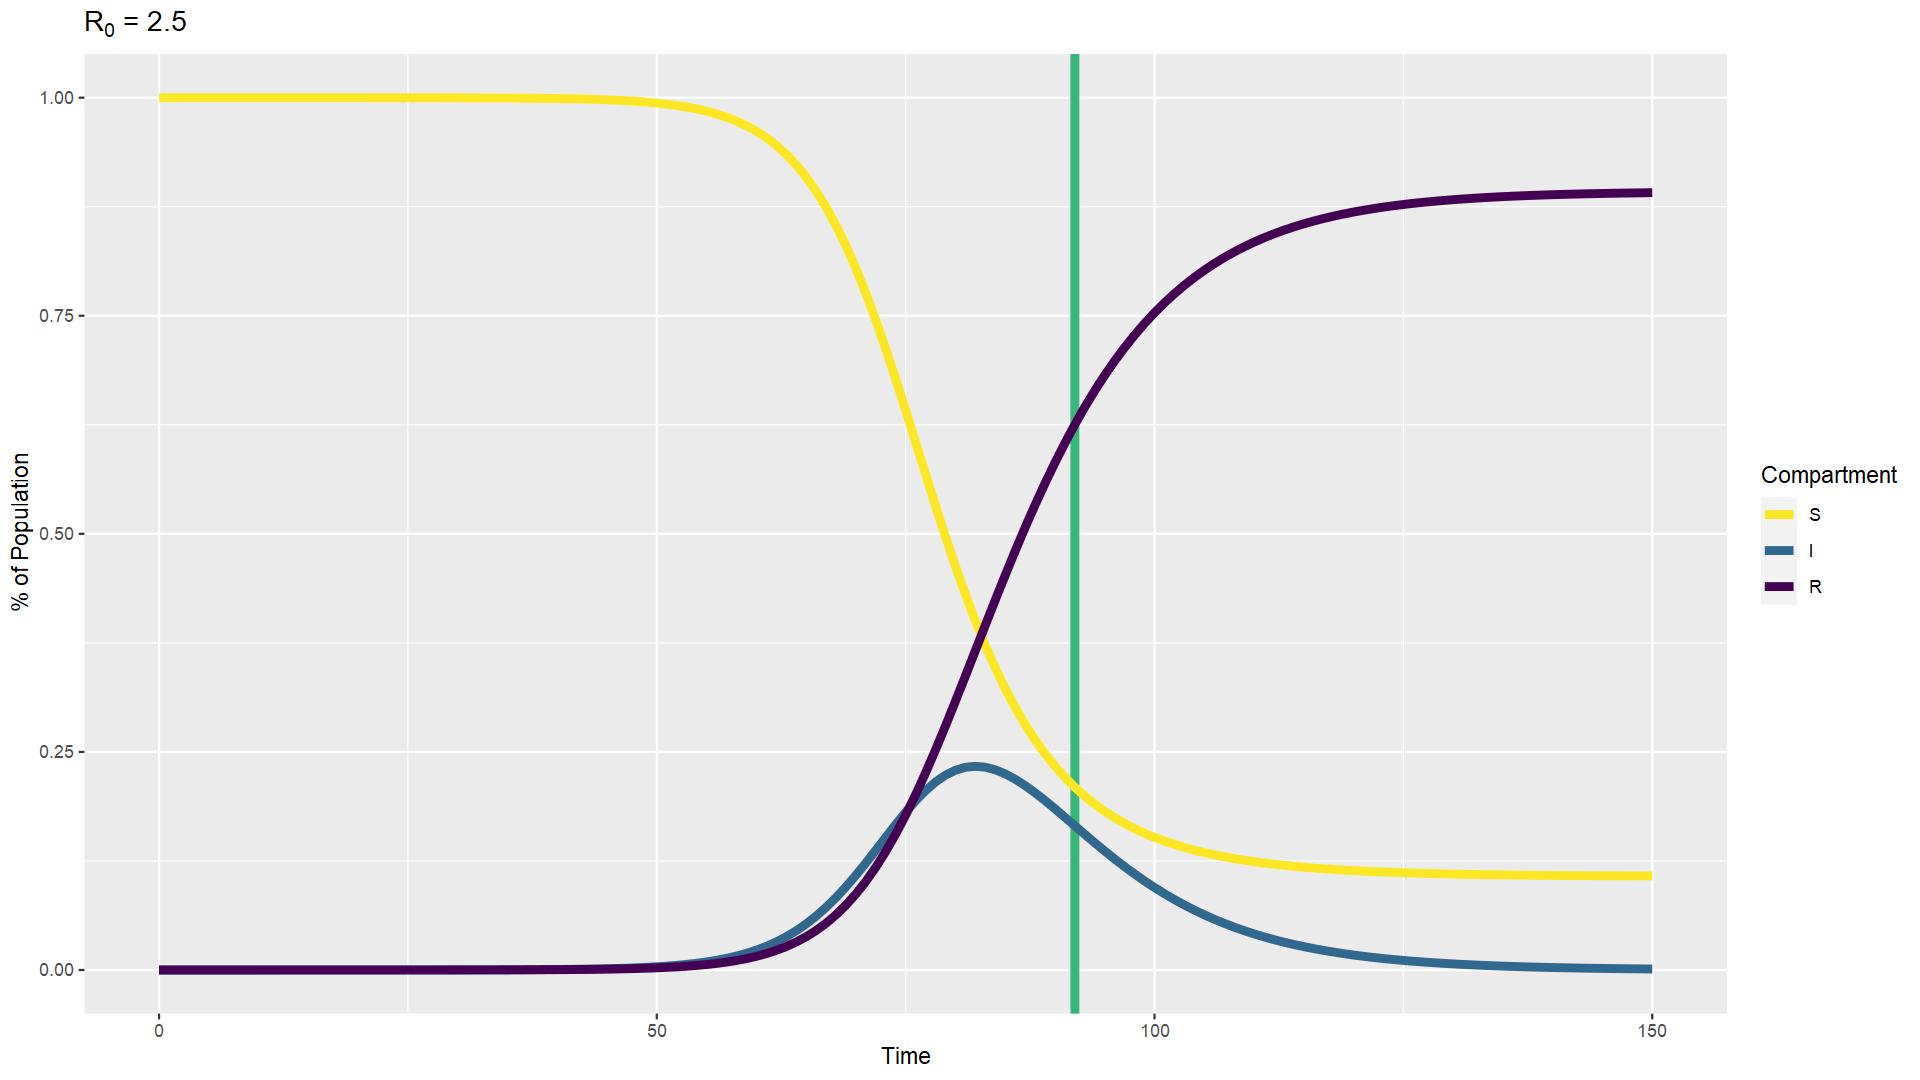
When SARS-CoV-2 first emerged and we estimated the R0 around 2.5 to 3, we could calculate a herd immunity threshold of 60% to 67%. I’ve created an SIR simulation with an R0 of 2.5 and plotted a vertical line at the time when the percentage of recovered people reaches 60% (above). You can see that’s well before the point at which there are no infected people. The disease is still spreading after that herd immunity threshold is reached, it is just spreading less and less. Thus we need to expect that there will continue to be cases after herd immunity.
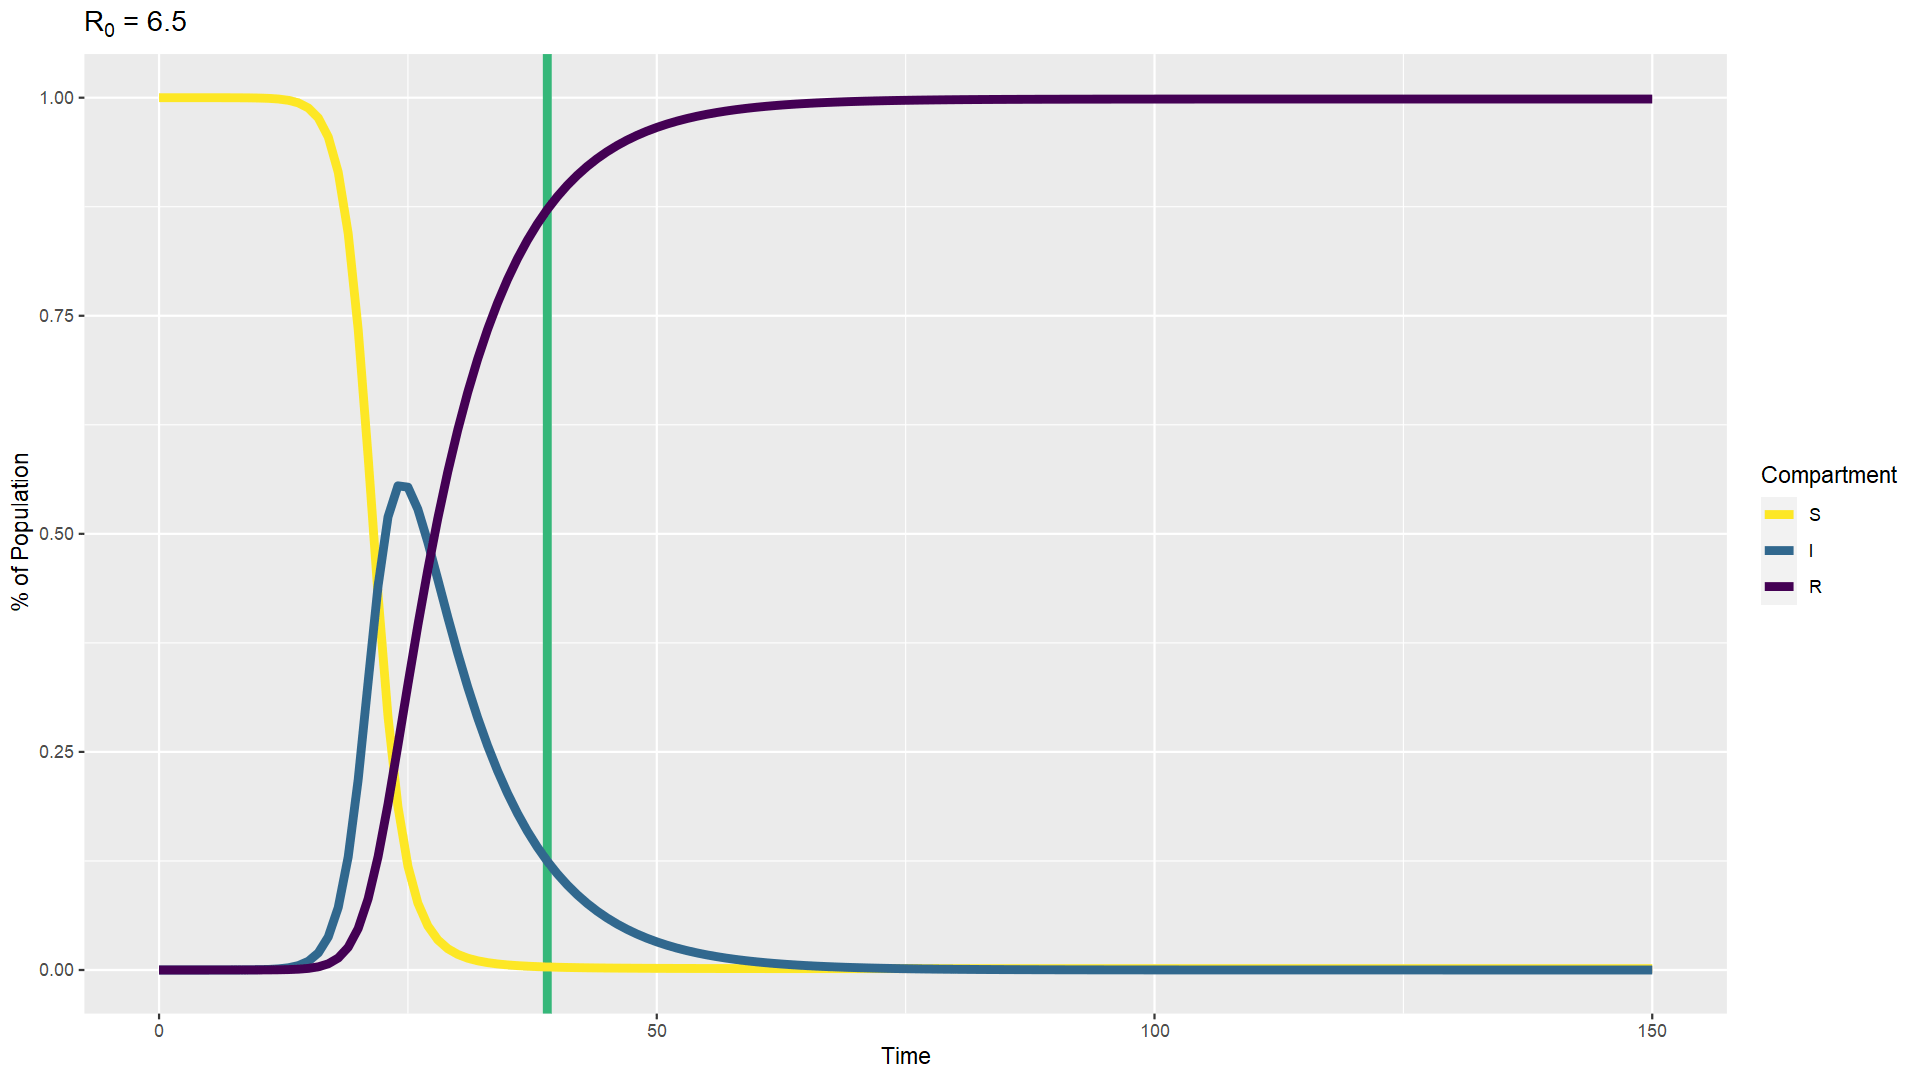
We also need to keep in mind that the Delta variant changes the math, and subsequent variants may change it further. The R0 of the Delta variant of SARS-CoV-2 is currently estimated between 6 and 7. If we use a value of 6.5, we get a herd immunity threshold of 85%. You can see how that model would play out above. You’ll note that the higher infectivity means the peak occurs sooner and gets higher, and nearly everyone winds up infected at some point despite the population eventually reaching the herd immunity threshold. That’s because so many people are infected so quickly and stay infected for a while before recovering that everyone gets infected, and then enough of them recover to cross the herd immunity threshold.
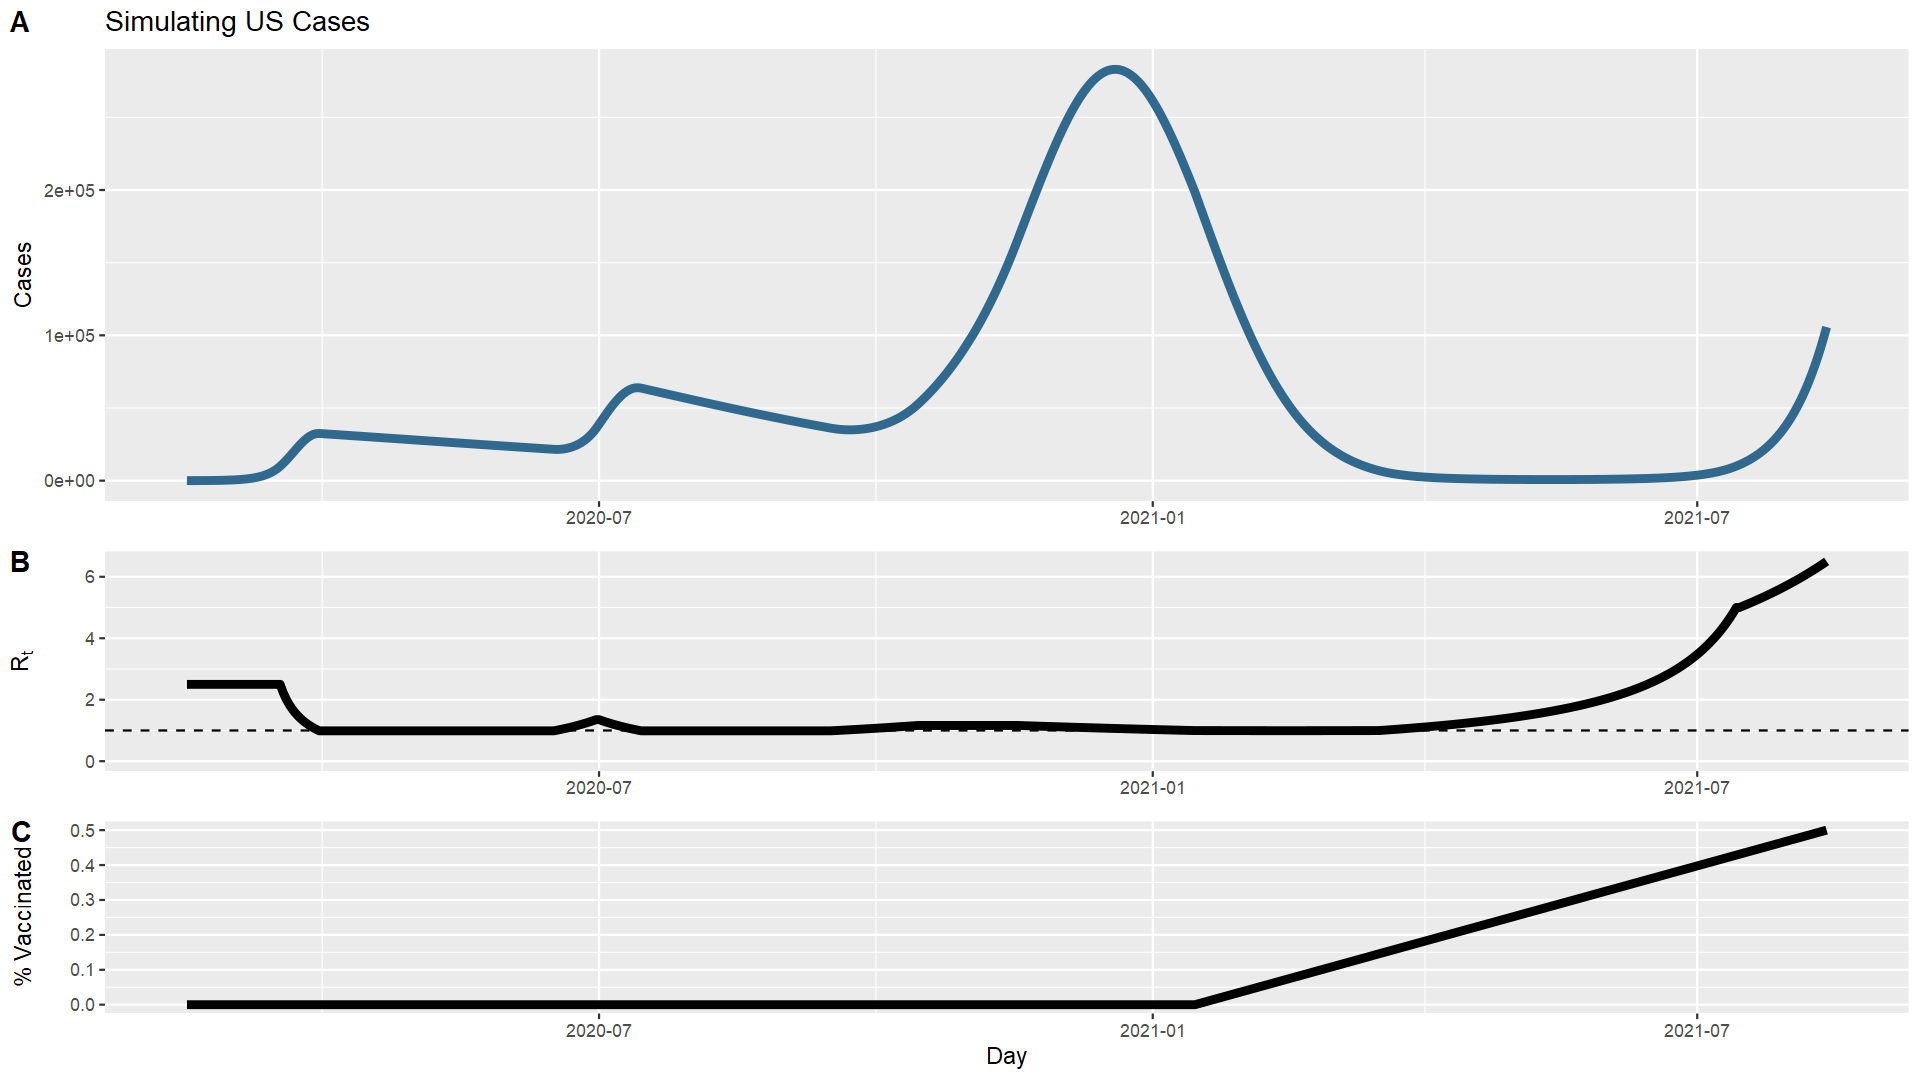
But of course that simulation looks nothing like what has actually occurred in the United States. Most obviously, we didn’t start with the Delta variant. Also significantly, we intervened with masks, distancing, remote work & school, and eventually vaccines. Those interventions can be represented by changes to the model parameters over time, driving transmission up or down. I took a crack at tweaking the parameters to create a timeline that at least broadly followed the contours of the US case counts to date. I’ve charted the counts of new cases above (you can compare with the top chart on this page of actual data), along with the changing Rt that I used to get those results. Basically, I started at 2.5, then simulated interventions to bring it down just below 1, then allowed it to fluctuate above and below 1 to track the ups and downs, then a few months ago started it increasing up to 6.5. I also simulated vaccination such that 50% of the population is vaccinated by the end of simulation, comparable to the current situation. This is still a very crude model that differs from reality in meaningful ways, such as the lack of accounting for asymptomatic infections that didn’t get counted as cases or the fact that immunity is not 100% effective. And the case counts drop much lower through this spring than actually happened; I couldn’t find the right parameters to get a closer match. Still, we can ask what the transition to herd immunity will look like in this simulation as a closer approximation to our circumstances than the completely naïve model we looked at before.
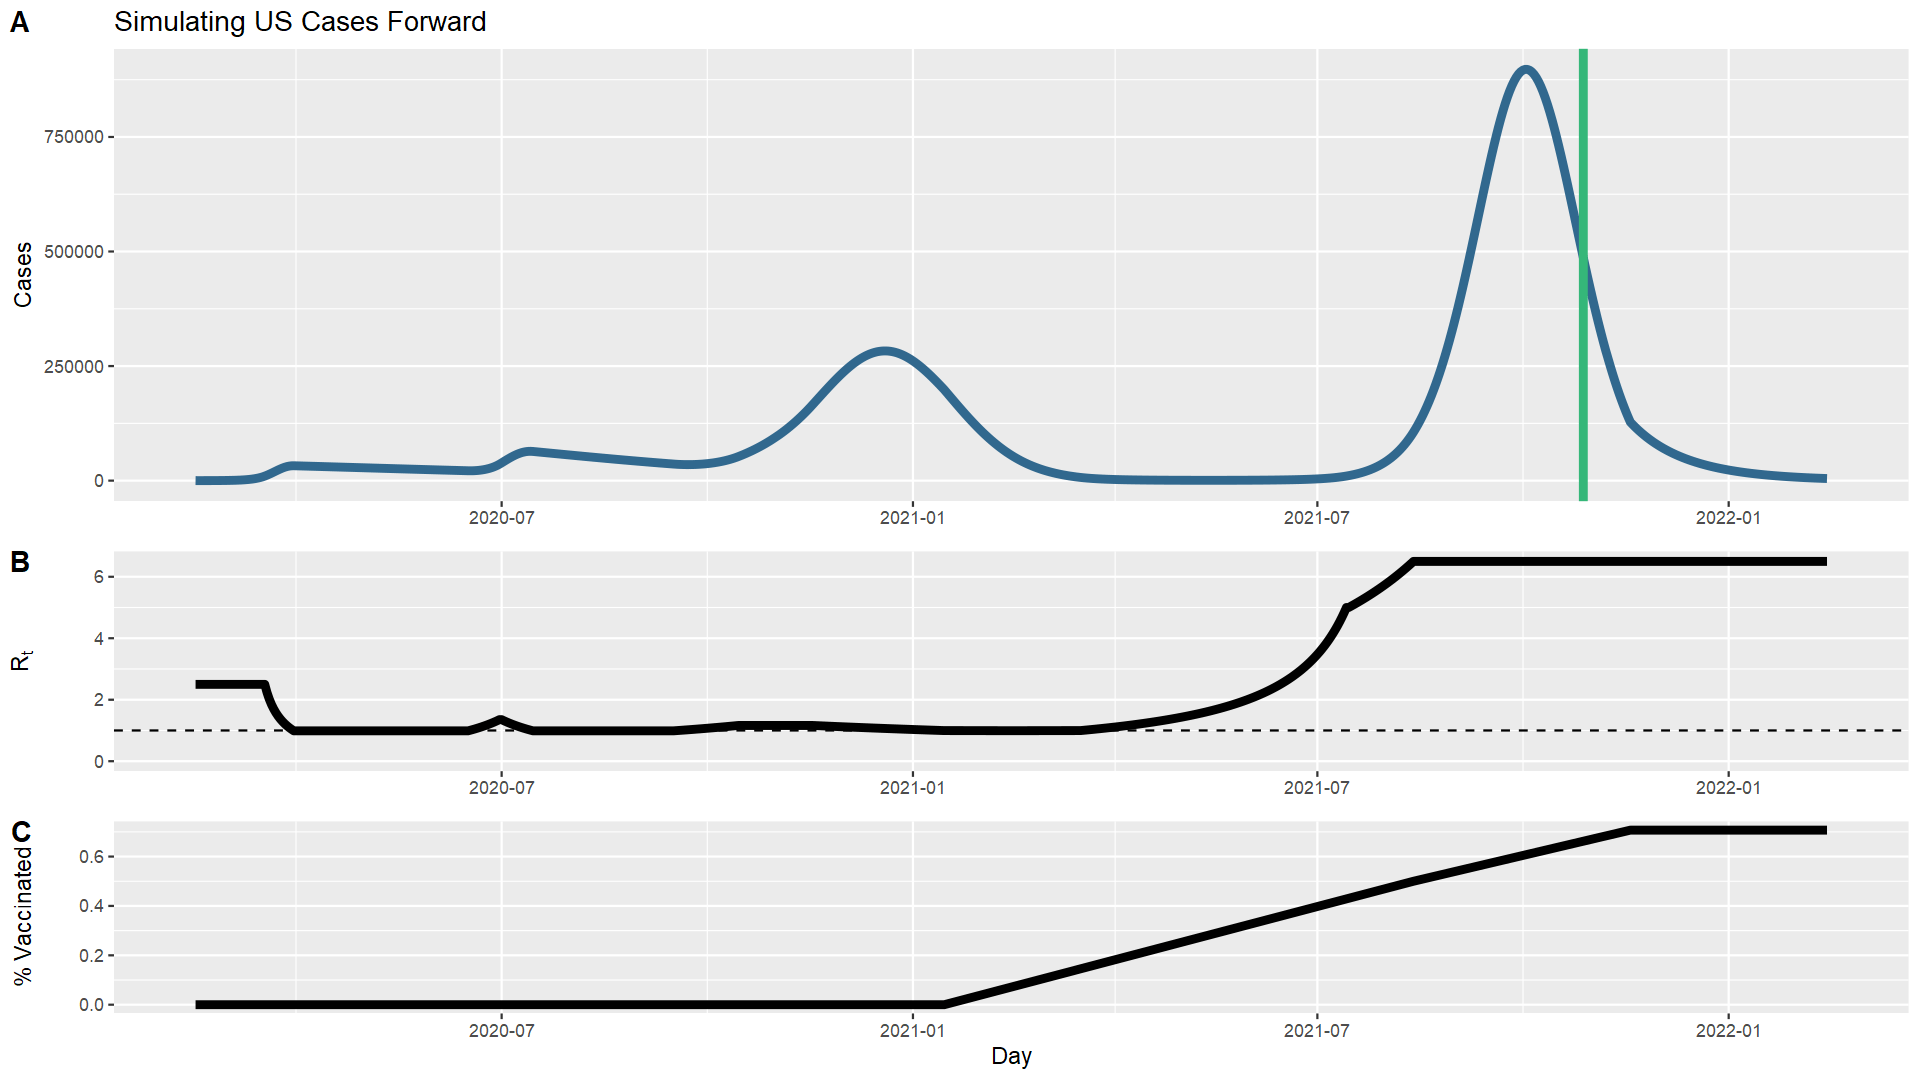
I let the simulation run from where it left off (now) through to mid-February of next year, completing two full years. I allowed vaccination to continue until 90% of the population was resistant, to allow for some persistent decliners, folks who are medically ineligible, and the youngest children who may not be vaccinated in that time frame. Note that the fraction of vaccinated tops out lower than that; this is because the model doesn’t take into account those who were infected and then vaccinated. I also allowed the Rt to stay at 6.5, just to see the behavior. I don’t think this is a realistic assumption; we are likely to continue intervening to reduce it. But the point here is not to provide robust predictions of what I think will happen, just a simulation to build our intuition of what herd immunity looks like in different scenarios.
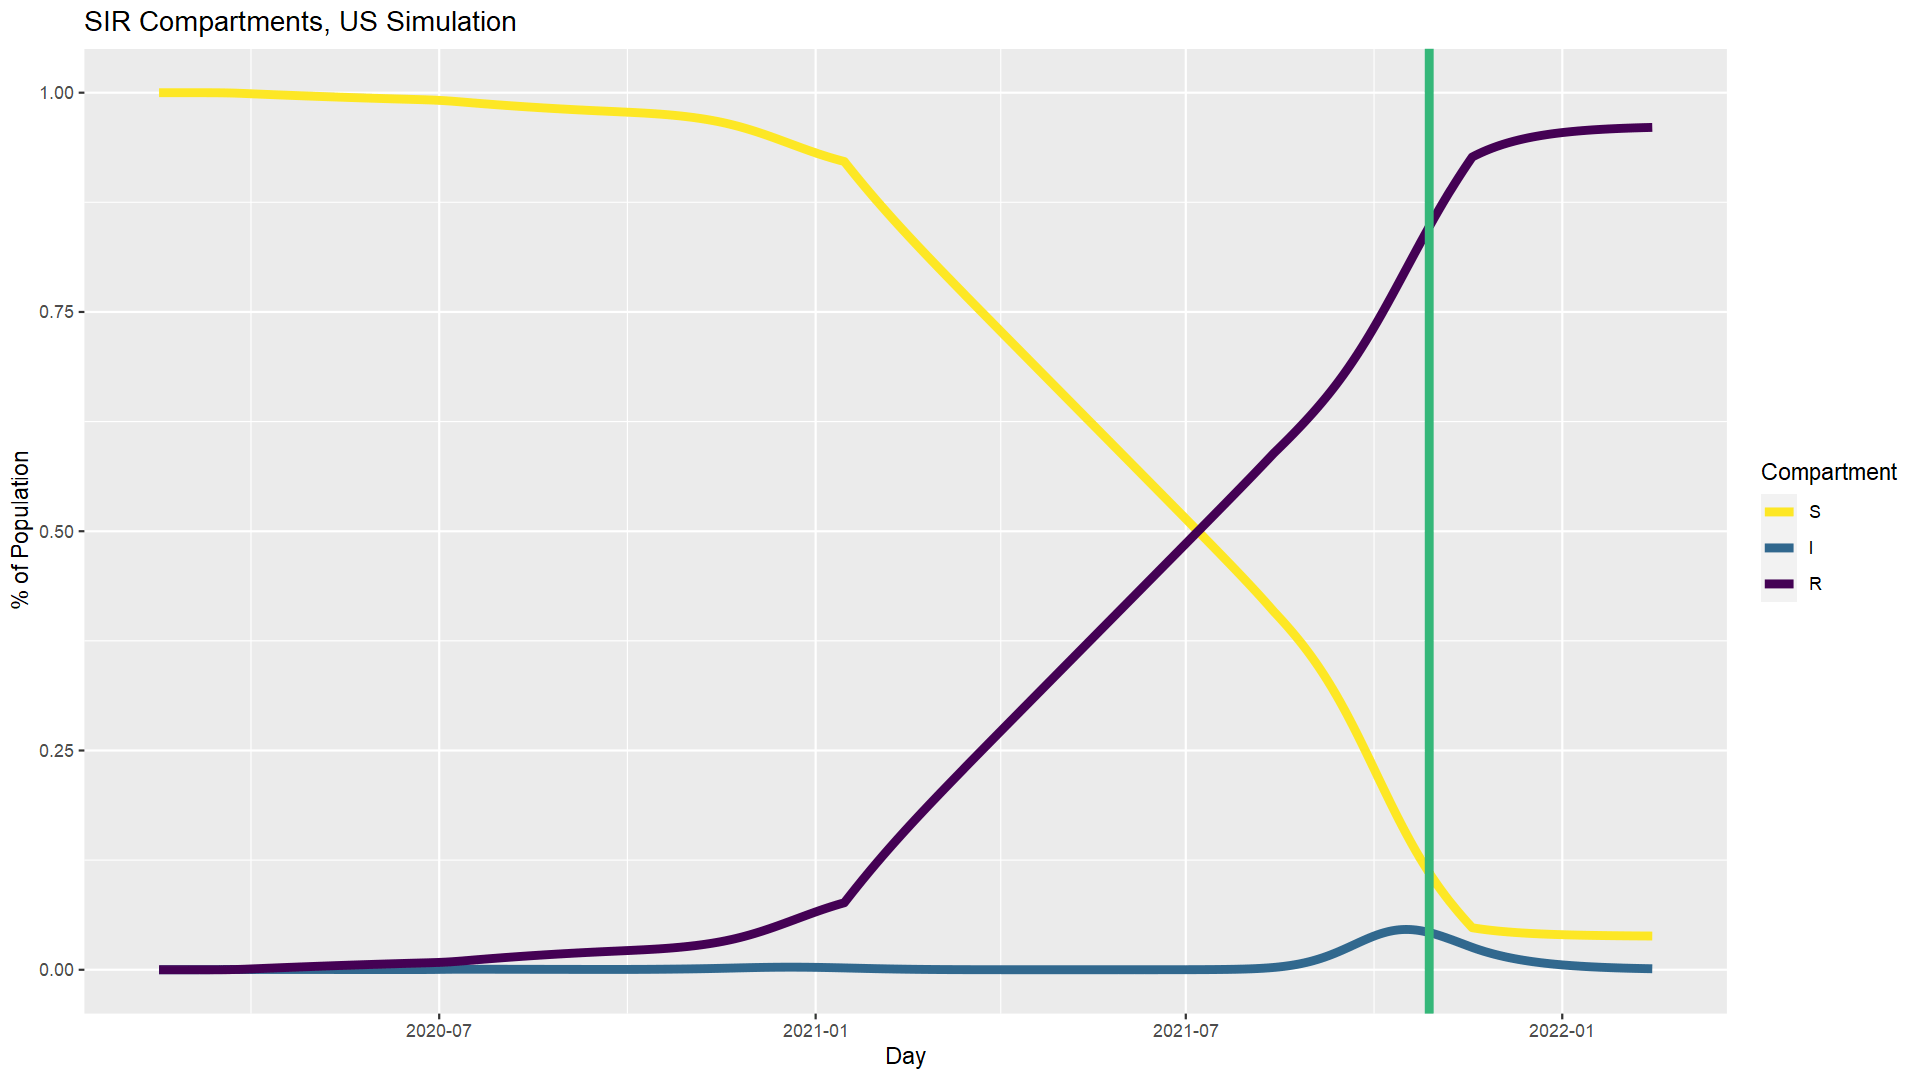
I’ve also charted the SIR percentages as before (above) so you can see what that looks like compared to the simpler models. In this particular simulation, even with incomplete vaccination and no further mitigation, a fraction of susceptible people remain at the end, in contrast to the constant 6.5 model. Also notice how different these trajectories are. Even in the constant 2.5 model, at one point 25% of the population is infected all at once. Our mitigation efforts successfully flattened the curve, keeping us far away from that worst-case (and probably not entirely realistic) scenario. And there is reason to think some further mitigation on top of the ongoing vaccination campaign would be worthwhile.
I know this was a bit longer than normal, but I hope this discussion gives you a better sense of what herd immunity means–and doesn’t mean–and provides some encouragement that we still have opportunities to love our neighbors to maximize the benefits from herd immunity to the vulnerable folks who cannot be vaccinated.
Andy has worn many hats in his life. He knows this is a dreadfully clichéd notion, but since it is also literally true he uses it anyway. Among his current metaphorical hats: husband of one wife, father of two teenagers, reader of science fiction and science fact, enthusiast of contemporary symphonic music, and chief science officer. Previous metaphorical hats include: comp bio postdoc, molecular biology grad student, InterVarsity chapter president (that one came with a literal hat), music store clerk, house painter, and mosquito trapper. Among his more unique literal hats: British bobby, captain’s hats (of varying levels of authenticity) of several specific vessels, a deerstalker from 221B Baker St, and a railroad engineer’s cap. His monthly Science in Review is drawn from his weekly Science Corner posts — Wednesdays, 8am (Eastern) on the Emerging Scholars Network Blog. His book Faith across the Multiverse is available from Hendrickson.
Leave a Reply