We talk a lot about science here, but science isn’t just talk. I thought maybe we could roll up our sleeves and try a little science. Our options are limited by the blog format, but it’s a pretty good platform for data science and machine learning. Don’t worry, the computer will do all the work; you can just follow along if you don’t want to deal with code.
Before we get into the code, you might be wondering why Over the past few weeks, we’ve been talking about the value of diverse perspectives to get the best and most representative results in our science. Diversity and its value can be abstract, so I thought the following machine learning exercise might make those topics more concrete. In our limited time and space, we obviously can’t demonstrate definitively the value of inclusive representation. What follows should be read as an illustration rather than any kind of proof.
The following code is in a language called R. It’s widely used in a variety of scientific disciplines for statistical analysis. I’ve been using it for almost 20 years, and knowing how may be the single most important skill I learned in grad school in terms of providing future career opportunities. If you expect to have a career in the sciences that involves data, R might be worth learning. For now, you just need to press ‘Run’ to make it go.
Scientists are always developing new methods in R, making it important to compare how those methods perform at the same tasks on the same data. For that reason, R comes with a number of data sets for method evaluation. We’ll be using a data set on tumor biopsies. (Don’t worry; this is completely anonymous data approved for distribution.) Several pieces of data were collected about each tumor like cell size and shape. The biopsy conclusion, benign or malignant, is also included; the other observations can be used to predict that conclusion. This is a classic machine learning problem called classification.
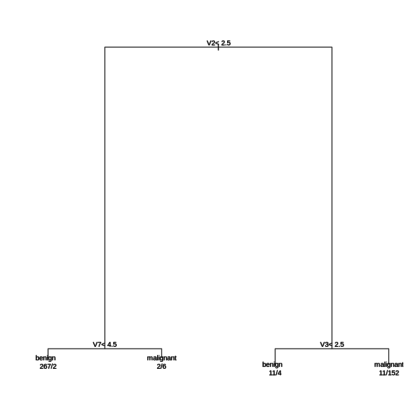
One approach to this kind of problem is called a decision tree. A decision tree is a group of either/or questions to be answered in a particular order that depends on the answers to previous questions. At some point you reach a question and the answer tells you whether the tumor is benign or malignant. How the algorithm decides which questions to ask and where the answers lead is a topic for another time. Suffice to say, the following R code will look at the data and figure out a series of questions that does a decent job of putting each record into the right category. The code will print a text version of the tree; a graphical visualization is below.
	library(MASS)

	library(randomForest)

	library(rpart)

	library(dplyr)

	library(tidyr)

	attach(biopsy)

	set.seed(1138)

	biopsy <- biopsy %>% select(-ID) %>% na.omit
	training.set <- sample(1:nrow(biopsy), 2 * nrow(biopsy) / 3)
	biopsy.dt <- rpart(class ~ ., data = biopsy, subset = training.set)
	biopsy.dt

To read the tree, start at the top. For each tumor, look at variable V2--uniformity of cell size--and check if it is less than 2.5. If it is, go to the left; if it's more, go to the right. Let's go left; now we check V7--bland chromatin-- and see if it is less than 4.5. If it is, we label the tumor benign. The numbers indicate that 269 tumors meet these criteria, 267 of which are actually benign and two of which are malignant. So our tree is good, but not perfect.
We can ask how good by asking it to label more tumors that it hasn't seen yet. That's why we took a sample training set from the full set of biopsies; we'll use the rest to test our tree. The code below will do that, then tabulate how often the tree agrees with the medical assessment.
	library(MASS)

	library(randomForest)

	library(rpart)

	library(dplyr)

	library(tidyr)

	attach(biopsy)

	set.seed(1138)

	biopsy <- biopsy %>% select(-ID) %>% na.omit

	training.set <- sample(1:nrow(biopsy), 2 * nrow(biopsy) / 3)
	biopsy.dt <- rpart(class ~ ., data = biopsy, subset = training.set)
table(biopsy$class[-training.set], predict(biopsy.dt, newdata = biopsy[-training.set,], type = "class"))
Looks pretty good; it's right about 140 benign tumors and 72 malignant tumors, which is 93% of the test records. But we can do better. We can use a technique called random forest. The idea behind the random forest is to build a bunch of decision trees from different small subsets of the data, then let each one 'vote' on a classification and take the majority decision. The code below will run the random forest algorithm, then tabulate how well its predictions match the medical assessment for the same test set we used before.
	library(MASS)

	library(randomForest)

	library(rpart)

	library(dplyr)

	library(tidyr)

	attach(biopsy)

	set.seed(1138)

	biopsy <- biopsy %>% select(-ID) %>% na.omit

	training.set <- sample(1:nrow(biopsy), 2 * nrow(biopsy) / 3)
	biopsy.rf <- randomForest(class ~ ., data = biopsy, subset = training.set)
	table(biopsy$class[-training.set], predict(biopsy.rf, newdata = biopsy[-training.set,]))
Our random forest is right about 149 benign tumors and 74 malignant ones. That's 98% of the records. Going from 93% to 98% may not seem like a huge improvement, but such incremental improvements are meaningful in machine learning. And this is just one example on a relatively small data set.
One reason the random forest approach is an improvement is that it overcomes the tendency of a decision tree to fixate on the idiosyncrasies of the training data. Of course, each individual tree in a random forest has the same weakness. But still, by letting different trees fixate on different subsets and pooling their decisions, we get better results.
Now, I don't think we can directly generalize from that to how people work. But again, I think it's a helpful illustration, and helps us formulate questions about people in new ways. For example, does this tell us something about why democracy works, and why it works best when everyone participates? After all, we each see our own part of the puzzle that is the world; nobody sees the whole thing. And so we each have our own fixations and our own blindspots, hence the value of making collective decisions. Maybe not in all cases (there are other machine learning methods which can do better than random forests on some kinds of problems), but certainly in some.
The other idea that comes to mind when I think about random forests is the cloud of witnesses from Hebrews 11. Knowing God fully is beyond any single one of us. Again, we each have an idiosyncratic theology based on our limited view. So we would do well to consider what that cloud, that whole cloud, has to say. Sure, maybe a simple majority rules approach may not be the best fit for theology, but we can take something from the advantages and disadvantages of decision trees and random forests and all to help inform an approach that includes a wide range of perspectives and also remains faithful to the God we are trying to follow.

If using science to illustrate theology excites you AND you want to broaden your understanding by hearing from other perspectives--why not join us in a conversation about Faith across the Multiverse? The book is all about scientific metaphors, and the discussion is bound to teach you (and me!) something new. The conversation starts this Sunday (9/30); details here: https://discourse.peacefulscience.org/t/book-club-faith-across-the-multiverse/1330
Andy has worn many hats in his life. He knows this is a dreadfully clichéd notion, but since it is also literally true he uses it anyway. Among his current metaphorical hats: husband of one wife, father of two teenagers, reader of science fiction and science fact, enthusiast of contemporary symphonic music, and chief science officer. Previous metaphorical hats include: comp bio postdoc, molecular biology grad student, InterVarsity chapter president (that one came with a literal hat), music store clerk, house painter, and mosquito trapper. Among his more unique literal hats: British bobby, captain’s hats (of varying levels of authenticity) of several specific vessels, a deerstalker from 221B Baker St, and a railroad engineer’s cap. His monthly Science in Review is drawn from his weekly Science Corner posts — Wednesdays, 8am (Eastern) on the Emerging Scholars Network Blog. His book Faith across the Multiverse is available from Hendrickson.

Nice usage of metaphor in explaining things! Cool!