If we’re going to take the sports angle to this tournament all the way, then at some point we need a “Moneyball” type to come in with formulas and spreadsheets to turn the whole thing on its head. Turns out that time is now, and that guy is me. I like my sports with a heavy dose of “advanced metrics” so I figured I’d try to bring a little of that flavor to our book tournament.
Let’s start by taking a closer look at what we mean by “best” book. In this format, what we really mean is “most head-to-head wins in a single elimination tournament.” Confessions was named the best book by that standard, but it was really only picked over 6 of the 63 other books. We can’t really say for sure that one or more of those 57 other books wouldn’t have beat Confessions if they had gone head to head. We assume this sort of transitivity (if A beats B and B beats C, A will beat C) when staging single elimination tournaments, but we know from experience that it doesn’t always hold. The most thorough measure would be to play out all 4,032 head-to-head matchups and see which book accumulates the most wins, but that’s a bit impractical. On the other hand, a biased sample of only 63 / 4,032 matchups may not be representative.
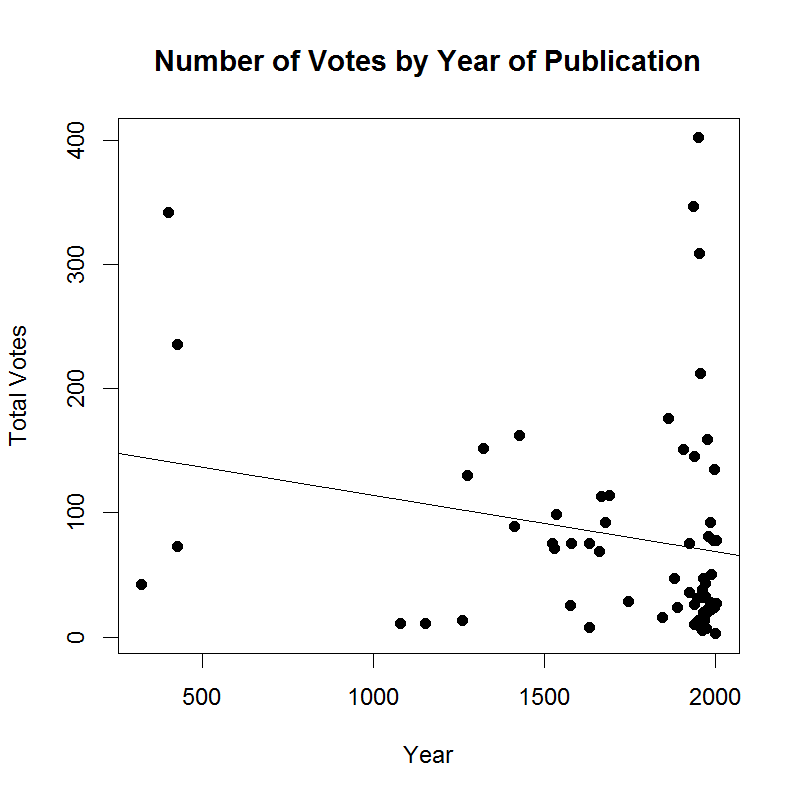
So then, what else can we learn from the tournament data we do have? For starters, we can look at the total number of votes accumulated during the tournament. Ranking by that metric, our top 5 are:
| Title | Votes |
| Mere Christianity | 402 |
| The Cost of Discipleship | 347 |
| Confessions | 342 |
| The Lord of the Rings | 309 |
| The City of God | 236 |
All of a sudden, our victor is in third place — and it’s not even close. Mere Christianity got 15% more votes than the next closest book, and 18% more than Confessions. In fact, it is so far ahead that even if we don’t count the votes Mere Christianity received in the last round (because those were “losing” votes), it would still wind up ahead by 17 points. This result is consistent with Mike’s observations that Mere Christianity was the most nominated book and seems to be the most popular anecdotally.
Now, you might be thinking that counting total votes is biased towards books that made it late into the tournament, and you’d be right. We can adjust for that by looking at average votes per matchup. Using that metric, we get the following top 5:
| Title | Average Votes |
| The Cost of Discipleship | 69.4 |
| Mere Christianity | 67 |
| The Lord of the Rings | 61.8 |
| The City of God | 59 |
| Les Misérables | 58.67 |
On this list, Confessions finishes 6th with 57 votes on average. The leaders here were likely helped by big first round victories; 4 of the 5 were the top vote-getters in the first round. This reminds us that votes are context dependent; they reflect more than just preference for a given book. In a given head-to-head contest, a voter may have been voting against a book rather than for one. We might then try to adjust for the strength of the opponent, to account for the different paths that each book took through the tournament. But here we run up against the limitations of the available data. We don’t have a good independent measure of which books are better. And we can’t use the tournament results themselves, because half of the books were eliminated in the first round; that rules out the possibility of adjusting the result of a given matchup by considering each book’s performance in all other matchups except that one.

However, we could try a crude adjustment by looking at genre. It turns out that the four genre regions differed significantly in vote counts. Theology & Apologetics, the region Mere Christianity came from, tallied 1,453 votes, while Memoirs, Devotionals & Spirituality only brought in 1,173. (Fiction & Poetry had 1,363 and Christian Life & Discipleship had 1,236.) If we scale the votes so that each genre got the same total, Confessions becomes the top vote-getter and moves into second place in the average vote ranking.
| Title | Total Adjusted Votes | Average Adjusted Votes |
| The Cost of Discipleship | 328 | 65.6 |
| Confessions | 342 | 57 |
| Mere Christianity | 321 | 53.5 |
| The Lord of the Rings | 263 | 52.6 |
| Les Misérables | 150 | 50 |
But is that a fair adjustment? Did the Theology & Apologetics region get more votes because its books are more popular on average? Does that mean we should discount its votes, or does that mean it was actually a tougher bracket to get through? Do fewer votes mean tougher matchups, leading to more people abstaining because they considered the opponents equal? Or were there more abstentions because one of the books was unfamiliar and voters felt uncomfortable voting against a book they didn’t know?
At this point, perhaps you are wondering how we come to any kind of conclusion if we can make the numbers say whatever we want. I would propose an alternate perspective. What attracts me to the advanced metrics school, and to statistics in general, is that expressing things numerically or mathematically really forces you to think clearly about what question you are asking and what the answer really means. In this little exercise, we’ve asked a few different questions; not surprisingly, they have different answers. But those answers all come from the data; I can’t make The Purpose Driven Life the answer to any of those questions if I just tweak the numbers the right way.
So, whether you agree or disagree with the results of this tournament, whether you liked my alternative lists or not, I hope this helps you to reflect more precisely on whatever questions you are asking.
Andy has worn many hats in his life. He knows this is a dreadfully clichéd notion, but since it is also literally true he uses it anyway. Among his current metaphorical hats: husband of one wife, father of two teenagers, reader of science fiction and science fact, enthusiast of contemporary symphonic music, and chief science officer. Previous metaphorical hats include: comp bio postdoc, molecular biology grad student, InterVarsity chapter president (that one came with a literal hat), music store clerk, house painter, and mosquito trapper. Among his more unique literal hats: British bobby, captain’s hats (of varying levels of authenticity) of several specific vessels, a deerstalker from 221B Baker St, and a railroad engineer’s cap. His monthly Science in Review is drawn from his weekly Science Corner posts — Wednesdays, 8am (Eastern) on the Emerging Scholars Network Blog. His book Faith across the Multiverse is available from Hendrickson.

brilliant.
Andy, these statistics make me irrationally happy. Thank you!