
You may have heard, although frankly it is probably just as well if you didn’t, that Elon Musk got some mixed results from SARS-CoV-2 rapid tests last week. He opted to use his celebrity to cast aspersions on the value of the tests. Normally I would consider that just another drop of noise in the roiling sea of nonsense. But I realized that the math involved in interpreting these tests is not altogether intuitive, and many of us might be uncertain what to do with such equivocal outcomes. And for some of us, that may already be or may become a concrete reality rather than a hypothetical exercise. So let’s talk through the numbers.
Per Musk, he had two positive results and two negative results. For simplicity, let’s assume that the tests were close enough in time that he didn’t change status along the way–that is to say, he didn’t get two negative results, then become infected, then have two positive results. In that case, two of the results must be wrong. At first glance, it might seem like a tie and so we’ve learned nothing. But in reality, while the particular result of two positives and two negatives is unlikely out of all the possible combinations of outcomes, it is much more likely to happen in one of the two possible scenarios (infected or not) than the other.
To see why, we need to be familiar with how tests are assessed. No screening test is perfect. There is always a chance it will return an incorrect result, and so we need to deal in probabilities. The most natural question to ask is “Given that I got a positive result, what is the probability I am actually infected?” This probability is the positive predictive value. A bit of math can show that while we can certainly answer this question, the value depends on the prevalence of the infection, or the fraction of people in the population who are infected. For the exact same test, the positive predictive value is higher if more people are infected. That makes it complicated to compare tests based on the positive predictive value, and so different probabilities that don’t depend on the prevalence tend to be used and reported.
The probabilities most commonly used are the sensitivity and specificity. Sensitivity answers the question “Given that I am actually infected, what is the probability that I get a positive result?” and specificity answers the question “Given that I am actually not infected, what is the probability that I get a negative result?” Those probabilities do not have to be the same and don’t have a fixed relationship with each other. Musk seems to have been given rapid antigen tests, which tend to have high specificity but somewhat lower sensitivity, a tradeoff for the quick results and simplicity of process. In other words, they will rarely be positive when there is no virus present, but they will sometimes be negative for infected people, especially if those people have less virus. For example, the BD Veritor test, mentioned in some reporting on Musk, has a specificity of 100% and a sensitivity of 84% as reported in this FDA document. Whether that is the exact test Musk got or if he got all four of the same brand I don’t know, but it doesn’t matter for this general discussion; other antigen tests have similar characteristics.
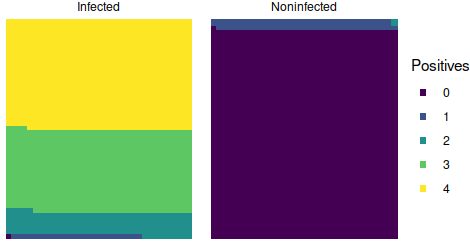
So, time to finally crunch some numbers. In the scenario where Musk is infected, the probability of a positive test is 0.84 and the probability of a negative test is 0.16. So the probability of whichever specific sequence of two positives and two negatives that Musk received is 0.84 x 0.84 x 0.16 x 0.16 = 0.018 or roughly 2%–unlikely, but not impossible. In the scenario that Musk is not infected, the probability of a positive test is 0 and the probability of a negative test is 1. In that case, the probability of his sequence is 0 x 0 x 1 x 1 = 0. Now, that is based on the reported specificity, but it is a bit too tidy; there is likely some small but nonzero chance of a false positive, just too small to have been occurred in the evaluation sample. For simplicity, let’s call it 1% (which is probably too high, but within the 95% confidence interval). So then the probability of his four results if Musk is infected is 0.018 or 2%, and the probability of those four results if Musk is not infected is 0.01 x 0.01 x 0.99 x 0.99 = 9.8×10^5 or roughly 0.01%. Thus, even though his particular sequence of results is very unlikely under either scenario, it is far more likely–184 times more likely in fact–if he is infected than if he isn’t.
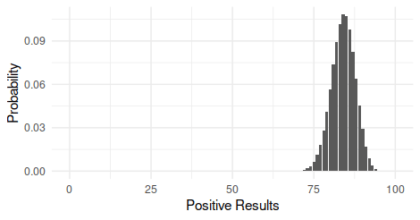
For completeness, since we don’t know the exact sequence of results, we can also calculate the probability of getting two positives and two negatives in any order. Since there are 6 such combinations, it is just the probability times 6, or 0.108 (11%) if he is infected and 0.00059 (0.06%) if he is not infected, and the outcome is still 184 times more likely if he is infected than if he isn’t. In other words, if 10 people who were infected each received 4 tests, we could expect 1 of them to have some sequence of 2 positives and 2 negatives.
Now, there is one very important caveat to those calculations. Multiplying probabilities requires independent events, meaning that the outcome of one doesn’t tell you anything about the outcome of another. In this case, it may not be a warranted assumption. For example, if the samples for the tests were taken very close together, there may be fewer virus particles available for subsequent swabs making later tests more likely to be negative. Since we can’t know if the events were really independent, we should not take the above estimates as the definite probabilities of the two scenarios and their relatively likelihood. Nevertheless, I hope the exercise and discussion make it clear that even though the results were not perfectly consistent, it is still the case that something can be learned from such outcomes and that they are not indicative of a bogus test.
Andy has worn many hats in his life. He knows this is a dreadfully clichéd notion, but since it is also literally true he uses it anyway. Among his current metaphorical hats: husband of one wife, father of two teenagers, reader of science fiction and science fact, enthusiast of contemporary symphonic music, and chief science officer. Previous metaphorical hats include: comp bio postdoc, molecular biology grad student, InterVarsity chapter president (that one came with a literal hat), music store clerk, house painter, and mosquito trapper. Among his more unique literal hats: British bobby, captain’s hats (of varying levels of authenticity) of several specific vessels, a deerstalker from 221B Baker St, and a railroad engineer’s cap. His monthly Science in Review is drawn from his weekly Science Corner posts — Wednesdays, 8am (Eastern) on the Emerging Scholars Network Blog. His book Faith across the Multiverse is available from Hendrickson.
Hi Andy,
thanks for those interesting calculations. To wind up, I think it would have been nice to take a final step from “how likely is the result if he is (not) infected?” to “how likely is it that he is actually infected given those results?” As you pointed out, the latter depends on the prevalence of the infection. Hence, the answer to this latter question will be quite different from the 1 to 184 ratio found for the former question simply because the number of people who are currently not infected is much larger. For example, if one person out of 185 is currently infected, the number of “two negative and two positive” results from infected and uninfected people will be approximately the same. That is, the chance that Elon Musk is infected given his results would be close to 50%.
Chris,
Thanks for the comment. Yes, the positive predictive value (PPV) of his combo of results will depend on the prevalence, and yes there is a value for the prevalence such that the PPV is 50%. I did not explore this further for a couple of reasons. One, I was not confident that I could provide a reasonable estimate of the appropriate prevalence. Two, I was already adjusting the specificity value for demonstration purposes. If we used the published estimate of specificity, 100%, then the PPV of any combination of results including one positive would be 100% regardless of prevalence.
However, since you brought it up, I got thinking about it some more and decided to see if we could at least put a lower bound on the prevalence. For the US population of 328 million, 1 out of 185 people is 1,772,973. According to the NY Times database, there were 1,552,915 cases reported in the 10 days leading up to November 18th when this was published. That’s a couple of days after Musk’s results, but there is also a lag in testing and reporting, so that’s a reasonable window and shifting a day or two won’t change things much. I went with a 10 day window because 10 days from symptom onset is when you can leave isolation (per the CDC), provided your symptoms are improving and you are fever free. Some people will have recovered before then, and some people will remain ill much longer. So it’s not a perfect estimate, but the new cases for 10 days should be a reasonable first approximation of the prevalence.
Now that 1,552,915 is just reported cases; we know that the percent of tests coming back positive was fairly high in some areas already by November 18th and we know asymptomatic infected people are a component of this disease. Both of those factors indicate that reported cases will be an undercount of the total prevalence of infections. If asymptomatic cases make up at least 13% of all cases, we get a prevalence higher than 1 out of 185 Americans, and 13% is in the lower end of the range of estimates for that ratio.
And all of that analysis is if we take the true specificity to be 99% instead of the reported estimate of 100%. If we take the true specificity to be 99.6%, which is what you would get from the FDA data if you added a single false positive to the results, then the prevalence that yields a break-even PPV is around 1 out of 1,138. That’s just 288,225 Americans, which is less than the number of new cases over the two days prior to November 18th. So we can be fairly confident the true prevalence was much higher than 1 in 1,138.
Now, there are still plenty of caveats here. None of this should be considered a rigorous method for estimating the prevalence for the US, just a quick attempt at ballparking a lower bound. And it would probably be more appropriate to use a prevalence estimate for a region around where Musk lives rather than for the entire US, and for a relevant demographic group. If you have a good source for a relevant estimate, feel free to share.