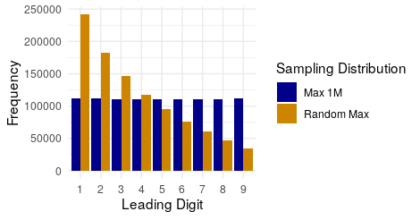
Take a list of numbers. Maybe it’s your lab’s itemized expenses, or the prices from a week’s grocery shopping, or a list of values for physical constants. Look at just the leading digit of all those numbers. So if the number is $1.59 then you get a 1, or if it’s 3.14 then you get a 3, and so forth. Now count up all the 1s, 2s, 3s, etc. What do you expect you’ll find? Are you imagining a roughly equal amount of each of the nine possible digits? If so, you are in good company, because that’s a common expectation. But there’s also a decent chance you are wrong.
For many real world data sets, what we actually observe is that the smaller digits are more likely, with 1 tending to be the most common digit. This observation is known as the Newcomb-Benford law (and a few other names). Nothing special needs to be true about the numbers to get this result. Actually, it is harder to get numbers that show an equal distribution of all nine leading digits. This reality has tripped up more than one attempt to perpetrate fiscal fraud. The plan is simple; keep a set of books with fabricated figures to show auditors or investors or whomever the outcome you want them to see, and fill it with random numbers. But if you do what comes naturally to many and choose your random numbers from a tidy range like 1 to 1000, you’ll wind up with numbers that satisfy the common conflation of random with uniform or equal and thus violate the Newcomb-Benford law. If anyone bothers to check–and increasingly, they do–your random numbers will then stick out from all the real financial records that follow the laws of both accounting and statistics.
Why is 1 the most likely digit? Basically, because of all the possible ranges a data set can span, ones that end at a round power of ten (10, 100, 1000, etc.) are very few. And if the range doesn’t end right on a power of ten, then there are some leading digits that are more common. To take an extreme example, consider the range from 10 to 199. If we list all the numbers in that range, there are one hundred and ten numbers that start with 1 and only ten that start with each of the other digits. The bias is less pronounced for other ranges, but if you play around a little bit you’ll see that most of them are biased in some way and frequently biased towards the smaller digits, the 1s and 2s.
Why all this talk of digits? Well, lists of physical constants are indeed among the data sets which follow the Newcomb-Benford law. Upon hearing this fact, someone thought they had stumbled on another argument for a creator. Their reasoning was that such a distribution of digits among the constants that describe our universe was unlikely to occur by chance, and no proposal had been made for wy it should be necessary, so the best explanation was that someone intended and caused that outcome. But it turns out such a distribution is likely to occur by chance, contrary to what seemed intuitive. I thought it was a good example of how our intuition alone can lead us down the wrong path; probability and randomness seem to be particular weaknesses of human intuition. And so we equate random with a lack of structure or pattern, when in fact mathematics is full of patterns that can arise randomly.

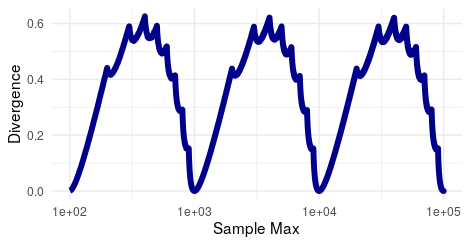
Just how common are distributions that follow the Newcomb-Benford law? I wondered that, so I set out to visualize the answer. I took every number from one hundred to one hundred thousand. Then I sampled one million random numbers between one and the number I was testing. So I sampled one million numbers between one and one hundred, between one and one hundred and one, between one and one hundred and two, and so on. For example sample of one million numbers, I worked out the frequency of each leading digit. Then I calculated the Kullback-Leibler divergence between that frequency and the equal distribution. I plotted that divergence against the maximum of each sample and got the sawtooth pattern in the image above. When the divergence is zero, the digits in the sampled numbers were roughly equal; the larger the divergence, the more the digits were biased towards small values. As you can see, only for a few samples with maxima near powers of ten is the divergence close to zero. For all other samples, the Newcomb-Benford law holds, which is what makes it a statistical law. (Note that the x-axis is a log scale, which makes it easier to see the repetition of the pattern. At the same time, the need for the log scale also highlights why the Newcomb-Benford law happens, because each time you add a place value there are ten times as many numbers that start with each digit and the ones that start with 1 come first.)
Andy has worn many hats in his life. He knows this is a dreadfully clichéd notion, but since it is also literally true he uses it anyway. Among his current metaphorical hats: husband of one wife, father of two teenagers, reader of science fiction and science fact, enthusiast of contemporary symphonic music, and chief science officer. Previous metaphorical hats include: comp bio postdoc, molecular biology grad student, InterVarsity chapter president (that one came with a literal hat), music store clerk, house painter, and mosquito trapper. Among his more unique literal hats: British bobby, captain’s hats (of varying levels of authenticity) of several specific vessels, a deerstalker from 221B Baker St, and a railroad engineer’s cap. His monthly Science in Review is drawn from his weekly Science Corner posts — Wednesdays, 8am (Eastern) on the Emerging Scholars Network Blog. His book Faith across the Multiverse is available from Hendrickson.

Leave a Reply