By the time you read this, the United States will be learning the outcomes of midterm elections. Obviously I don’t know the results to comment. Regardless of the outcome, though, I think it is likely we will continue to hear about the partisan divide or variations thereof. And that is a topic which science can offer some insight into, specifically the impact of social media on polarization–specifically, our increased sorting into homogeneous groups with little in common between them. If you suspect social media isn’t helping, you are likely right–but maybe not for the reason you think.
Last month a paper by Petter Törnberg came out summarizing research on social media and political polarization into a theory involving increased exposure to alternative viewpoints and subsequent sorting. That theory was then explored in a simulation model in which increased sorting emerges from the kind of local diversity of views that exist in actual physical space and the long-range interactions made possible by social media. That emerging sorting occurred even though individual interactions can only result in adopting a characteristic of someone else; there is no notion of choosing the opposite of what someone from the other group thinks.
As summarized by Törnberg, we’ve gone through several hypotheses about how polarization increases. The first was involved “echo chambers.” There the idea is that, by some combination of personal curation and algorithmic positive feedback loops, social media only exposes folks to ideas from people or sources they already agree with. This isolation in turn would allow for drift towards more extreme positions. Sounds plausible, but it turns out when we look at actual social media data, folks are not in these echo chambers. We see content from diverse sources, likely more diverse than we get IRL. The algorithms just want us to engage, and rebuttal comments and quote-tweet-dunks and hate-clicks count too. Further, the observed polarization is less characterized by increasingly extreme policy positions and more by greater negative emotions like disdain or animosity towards the other party. So the echo chamber option doesn’t seem to match what we’re actually seeing.
If we are seeing content from diverse sources via social media, then maybe it is polarizing us by triggering negative reactions. “Those people think X? Well then I definitely think the opposite of X!” There is some evidence of this kind of backfire effect from psychology experiments, but again when we look at what happens outside of controlled conditions it is less clear how often the backfire effect actually has an impact. So the research here explores a model that incorporates these empirical findings–no echo chambers and no backfire effect. Is it possible to still see polarization or sorting under those conditions?
The model to test this idea works like this. Each person belongs to one of two groups and has a set of characteristics that are originally assigned randomly. Those could represent anything: political preferences, favorite sports teams, personality traits, etc. Each person has neighbors, representing the folks we interact with locally. In each iteration of the model, neighbors exert influence on each other. A given person randomly updates one of their characteristics to the value of one of their neighbors. Neighbors who are already more similar are more likely to be chosen to exert this influence; the strength of this preference for influence by similar people is a parameter than can be adjusted. Group membership is one of the features involved in assessing similarity, but it is not a hard determinant; influence can cross group boundaries.
Iterations of influencing are repeated thousands of times. The outcome is assessed by measuring similarity within groups compared to similarity between groups. How likely is it that someone in my group shares my characteristics vs how likely is it someone from the other group does? With complete sorting–two groups that are internally homogeneous and completely different from each other–this metric will be 1. When the groups have no differences, the metric is 0.
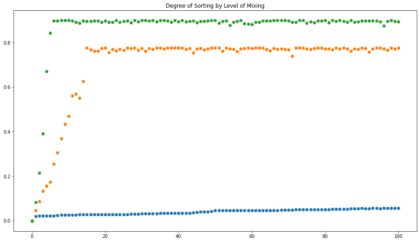
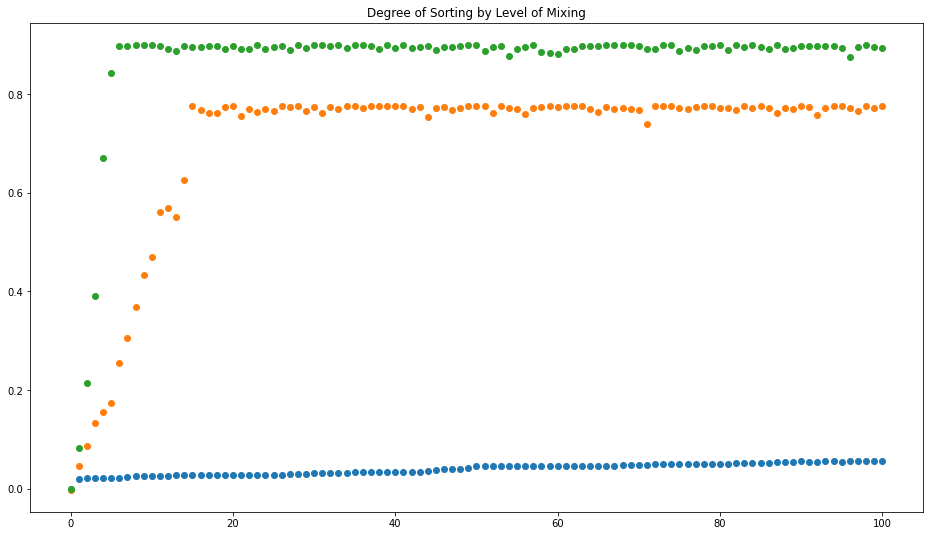
Now, let’s take a look at the blue dots below:

In that scenario, we see very little sorting. That’s the result when influence can only come from local neighbors. To add the impact of social media, we can swap some of the local neighbors with distant folks chosen at random. For the orange dots, we’re swapping half of the neighbors. For the green dots, we swap all of the neighbors. As you can see, in both of those scenarios, we get significant sorting. Keep in mind that this is without any sort of top-down influence; there is no group leadership dictating what defines the group. Folks start with random preferences and over time align those preferences with other people they come into contact with, preferring to align with people they are already similar to. That’s all it takes to sort folks into two distinct groups, in a way that doesn’t happen when all interactions stay local.
If that all feels a bit abstract, try thinking about it this way. Cast your mind back to the days before the Internet, when basically all of your interactions were physically local and also folks did not move as much. You might agree on taxes with one neighbor but go to a different church as them; another neighbor might go to your church but have a different view on immigration. And that neighbor across the street roots for the rival baseball team but they share your taste in books. All these folks might exert some influence on you, but it will be in all different directions with roughly equal magnitude. In this kind of setting, folks might change, but likely in small ways and not all together.
Now consider today, when you can interact with almost any of the 8 billion humans out there. With that many folks to choose from, you have a better chance of finding someone like you in many ways. You watch the same movies, enjoy the same food, feel the same way about government size, and so on. Such a person is likely to have a stronger influence on you to align those few areas where you don’t match. And now either one of you can exert that strong influence on other people who a nearly as similar, bringing them closer to you as well. Under those conditions, little nuclei will form that pull people in, creating a bigger and bigger group that is more and more homogeneous. Meanwhile, the other group is getting more and more different; if they weren’t, they would have been pulled into your group. It’s not hard to imagine then finding it harder and harder to relate to those ‘other’ folks.
This is exactly the kind of science I find endlessly fascinating, the kind where global patterns emerge from simple rules and interactions but are not immediately derivable from those rules. You can’t necessarily logic your way to the answer; you have to run the simulation. So I was very grateful that the author made his code for the model publicly available. That’s how I was able to generate the plot above. I put the code in a simple Jupyter Notebook; you are welcome to use that to experiment and see what combinations of parameters lead to greater sorting. Full details are in the paper (and if you can’t access the published version, the author made a preprint available), but briefly k is the number of groups; n is the number of characteristics each of which can have a value from 1 to m; c is how much group membership influences similarity; h is how much similarity impacts which neighbor is chosen to impart influence; gamma is the fraction of neighbors replaced with distant people; and nragents is the number of people. I only changed gamma to get the different lines in the plot; Törnberg shows results for different values of h as well. It would be interesting to see how the other parameters impact the outcome, and also whether any interventions can be implemented that reverse the sorting.
Incidentally, I went looking for news articles on this research since I figure some folks prefer those to reading the paper itself. The first two stories that came up were from Mother Jones and Reason–two sources in roughly equivalent points on the popular Media Bias Chart but on opposite sides of the centrist line. I didn’t notice much of a difference between the coverage, consistent with those outlets being labeled “Reliable for news, but high in analysis/opinion content. Maybe that can be a little reminder that even though the other group may genuinely be homogenizing into something very different than your group, they may not yet be completely incomprehensible.
Andy has worn many hats in his life. He knows this is a dreadfully clichéd notion, but since it is also literally true he uses it anyway. Among his current metaphorical hats: husband of one wife, father of two teenagers, reader of science fiction and science fact, enthusiast of contemporary symphonic music, and chief science officer. Previous metaphorical hats include: comp bio postdoc, molecular biology grad student, InterVarsity chapter president (that one came with a literal hat), music store clerk, house painter, and mosquito trapper. Among his more unique literal hats: British bobby, captain’s hats (of varying levels of authenticity) of several specific vessels, a deerstalker from 221B Baker St, and a railroad engineer’s cap. His monthly Science in Review is drawn from his weekly Science Corner posts — Wednesdays, 8am (Eastern) on the Emerging Scholars Network Blog. His book Faith across the Multiverse is available from Hendrickson.

Leave a Reply